Portfolio
Video Game Market Performance
& Investment Analysis
Self-directed project built in Power BI on a VGChartz/Metacritic video game sales dataset. Maps where sales concentrated, how the market shifted over time, whether review scores correlated with sales, and where regional gaps or reliable performers might point to opportunity.
Toy Company Sales
& Inventory Dashboard
Training project built in Power BI using the Maven Analytics Toy Store dataset. Tracks store-level sales against monthly targets and flags inventory risk across product categories and locations.
About Me
Fair warning: I'm one of those weirdos who genuinely likes spreadsheets. And when I can combine data modeling with visual design, I lose afternoons.I'm a Microsoft Certified Power BI Data Analyst Associate, and I come from a background in systems engineering, SQL Server administration and development, and operational reporting. At my last role I built reporting tools — an Excel-based scheduling system, Salesforce dashboards, a visual mapping tool for field logistics — most of which started as "we don't have anything that does this" problems.The projects on this site are recent Power BI work.Resume · Certification

Video Game Market Performance & Investment Analysis
Self-directed Power BI report — built around the kind of questions a publisher or investor might ask when deciding where to put money next. Maps where sales concentrated, how the market shifted over time, whether review scores correlated with sales, and where regional gaps or reliable performers might point to opportunity. Built on a VGChartz/Metacritic video game sales dataset.
What I Built
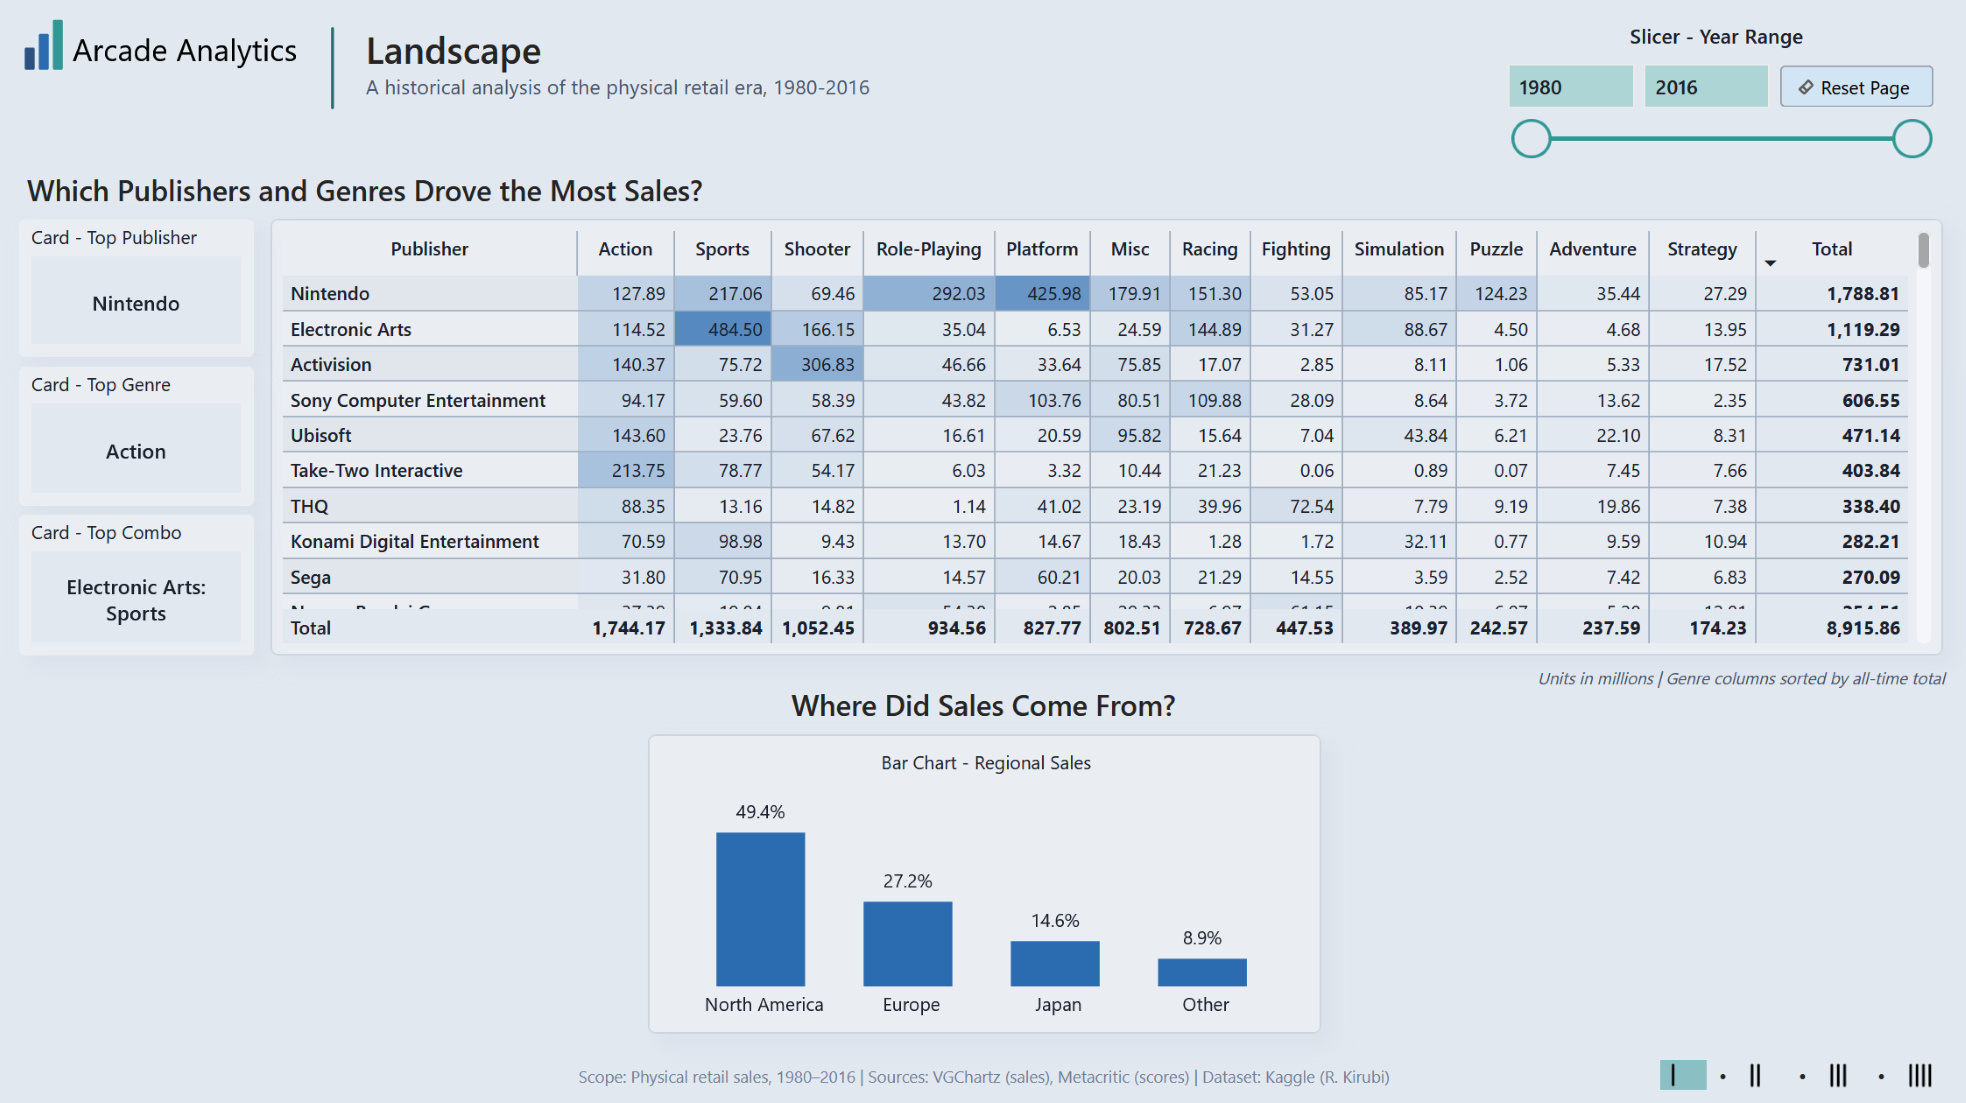
Four-page report covering the global physical retail video game market from 1980 to 2016.Page 1 (Landscape) sets up the big picture — who sold the most, in what genres and in what regions.Page 2 (Trajectory) tracks how the market shifted over time, with platform generations rising and falling and genre trends evolving over the years.Page 3 (Chasing Scores) tests whether review scores actually translated into sales, and whether critics and players agreed.Page 4 (Potential Opportunities) looks at the gaps — underrepresented genres in certain regions, and which publisher/genre combos delivered the most reliable returns per title.
Questions I dropped (and why)
1. I had planned to find publishers with strong review scores but low sales, with an eye toward investment. But the data didn't support this — high and low sales appeared across the score range. Titles with high scores and low sales weren't outliers. I dropped the question from the report rather than forcing a story.2. I had planned to chart which genres grew vs. declined over time. But since the data primarily covers physical sales, every genre appears to crash after about 2010. Physical sales peaked during the mid-to-late 2000s and then tapered off (likely as digital sales took over). I reframed the question as: "Which genres grew the most?"
Design for Readers
• Each page and visual organized around a question.
• Pages flow as a narrative, each one building on the last.
• Each visual designed to answer its question quickly.
• Findings called out where useful.
• Audience-friendly labels and explanatory text throughout.
Data Model
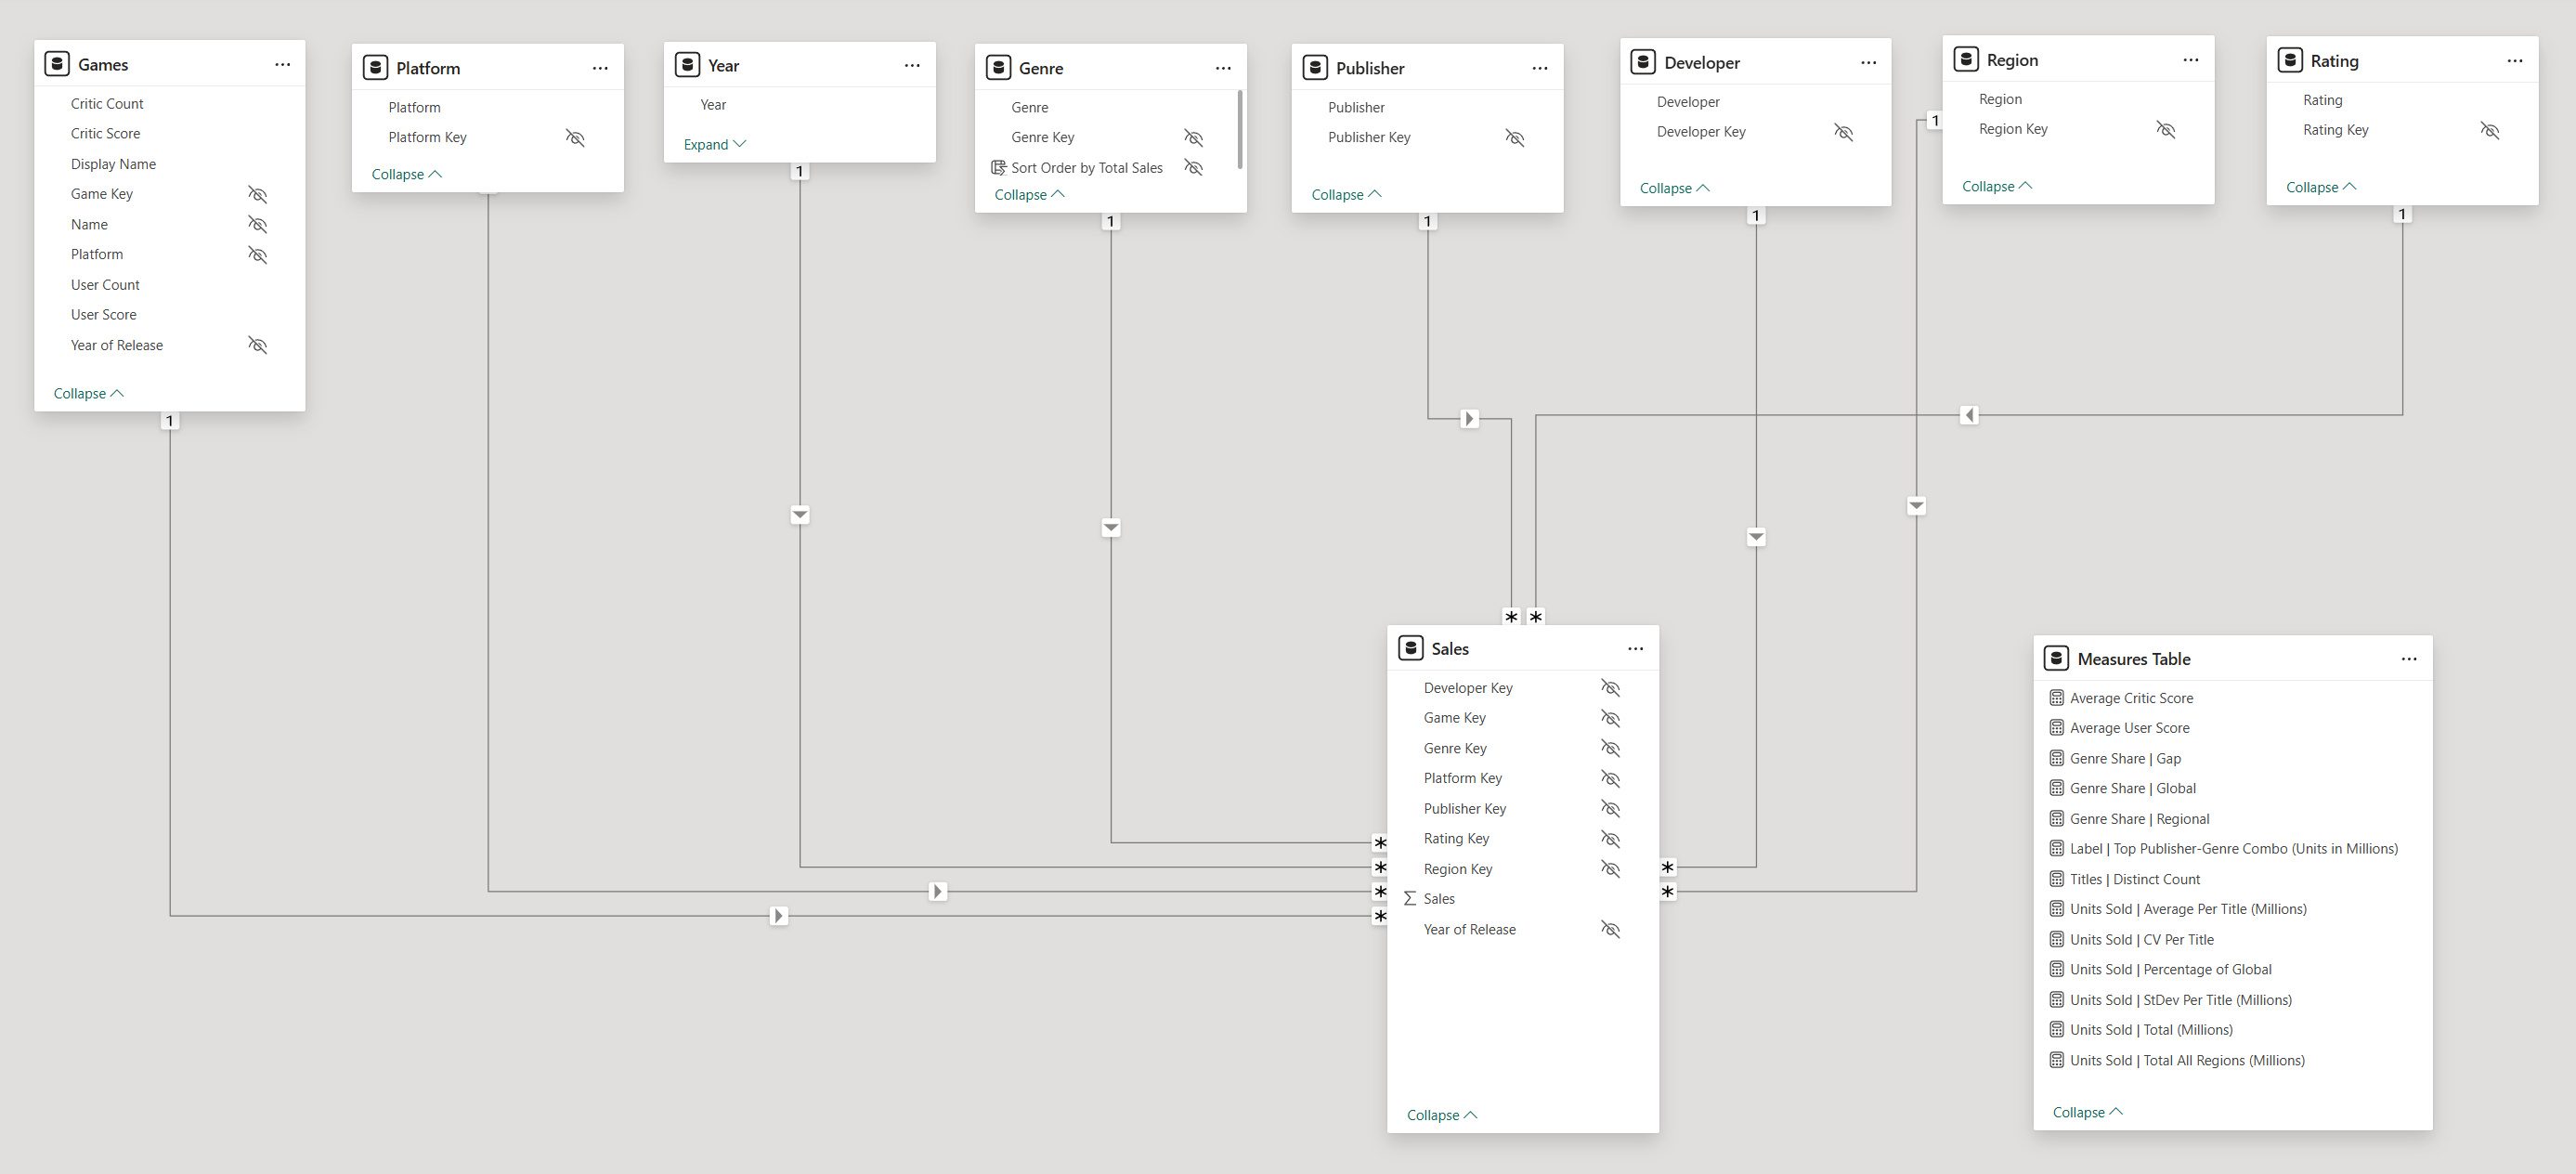
Star schema with one fact table and eight dimensions. The Region dimension was created by unpivoting the four-wide regional sales columns into rows. One-to-many relationships with single-direction filtering. Separate measures table with display folders for organization.
Source
Based on a dataset compiled by Rush Kirubi via Kaggle, from VGChartz (sales data) and Metacritic (critic and user scores).Known limitations:
• Sales figures are primarily based on estimated physical retail sales. Digital sales are not comprehensively tracked.
• The data only tracks games with greater than 100,000 units moved.
Tooling
Used Tabular Editor to apply BPA rules, standardize formatting, correct summarization behavior, hide technical keys, and organize measures into display folders — resulting in a clean, well-organized semantic model.Ran VertiPaq Analyzer in DAX Studio to validate the model. 3.1 MB across 10 tables and 32 columns — clean star schema, no bloat.
Data Prep & Model Decisions
Regional sales came in as four wide columns — NA, EU, JP, Other. Unpivoted them into rows so I could slice by region. Dropped the now-redundant Global_Sales column.Filtered out all data after 2016. It was too incomplete to be useful. Final dataset contains 16,713 games.Added a sort-by column to the Genre dimension to support the heatmap sales matrix on page one.The Games dimension has a composite key across three columns (Name, Platform, Year). For visuals, I added a single ‘Display Name’ column in Power Query that concatenates these values, then hid the Name, Platform, and Year columns in the data model. I added notes to the column descriptions to self-document this setup. The columns could have been dropped instead of hidden, but I opted to leave them available.
DAX Highlights
1. For the Reliable Performers scatter chart, I wanted to compare high average sales against sales reliability — is this publisher/genre consistent vs boom-or-bust? Average sales alone don’t give the full story. I used standard deviation, converted to a CV (shown as a percentage) so combos at different volumes would compare on equal footing:
Units Sold | CV Per Title =
// Coefficient of Variation (makes standard deviation "fair" for differing sales scales)
DIVIDE (
[Units Sold | StDev Per Title (Millions)],
[Units Sold | Average Per Title (Millions)]
)
Units Sold | StDev Per Title (Millions) =
// Standard deviation
STDEVX.P (
VALUES ('Sales'[Game Key]),
[Units Sold | Total (Millions)]
)
2. Use of CROSSFILTER to let Sales-side filters reach Games while keeping the model single-direction overall:
Average Critic Score =
CALCULATE(
AVERAGE('Games'[Critic Score]),
CROSSFILTER('Sales'[Game Key], 'Games'[Game Key], Both)
)
Average User Score =
CALCULATE(
AVERAGE('Games'[User Score]),
CROSSFILTER('Sales'[Game Key], 'Games'[Game Key], Both)
)
3. Layered measures—clean and simple, each measure does one job. Validated by confirming regional and global shares each sum to 100% and gap totals sum to 0%.
Genre Share | Gap =
// Gap between regional and global share. Negative = under-indexed; positive = over-indexed.
[Genre Share | Regional] - [Genre Share | Global]
Genre Share | Regional =
// Genre's share of regional sales (within current region's total)
DIVIDE (
[Units Sold | Total (Millions)],
CALCULATE (
[Units Sold | Total (Millions)],
REMOVEFILTERS ('Genre')
)
)
Genre Share | Global =
// Genre's share of global sales
DIVIDE (
CALCULATE (
[Units Sold | Total (Millions)],
REMOVEFILTERS ('Region')
),
CALCULATE (
[Units Sold | Total (Millions)],
REMOVEFILTERS ( 'Region'),
REMOVEFILTERS ( 'Genre')
)
)
Toy Company Sales & Inventory Dashboard
This dashboard tracks store-level sales performance against monthly targets and flags inventory risk across product categories and locations. Built in Power BI using the Maven Analytics Toy Store dataset.
What I Built
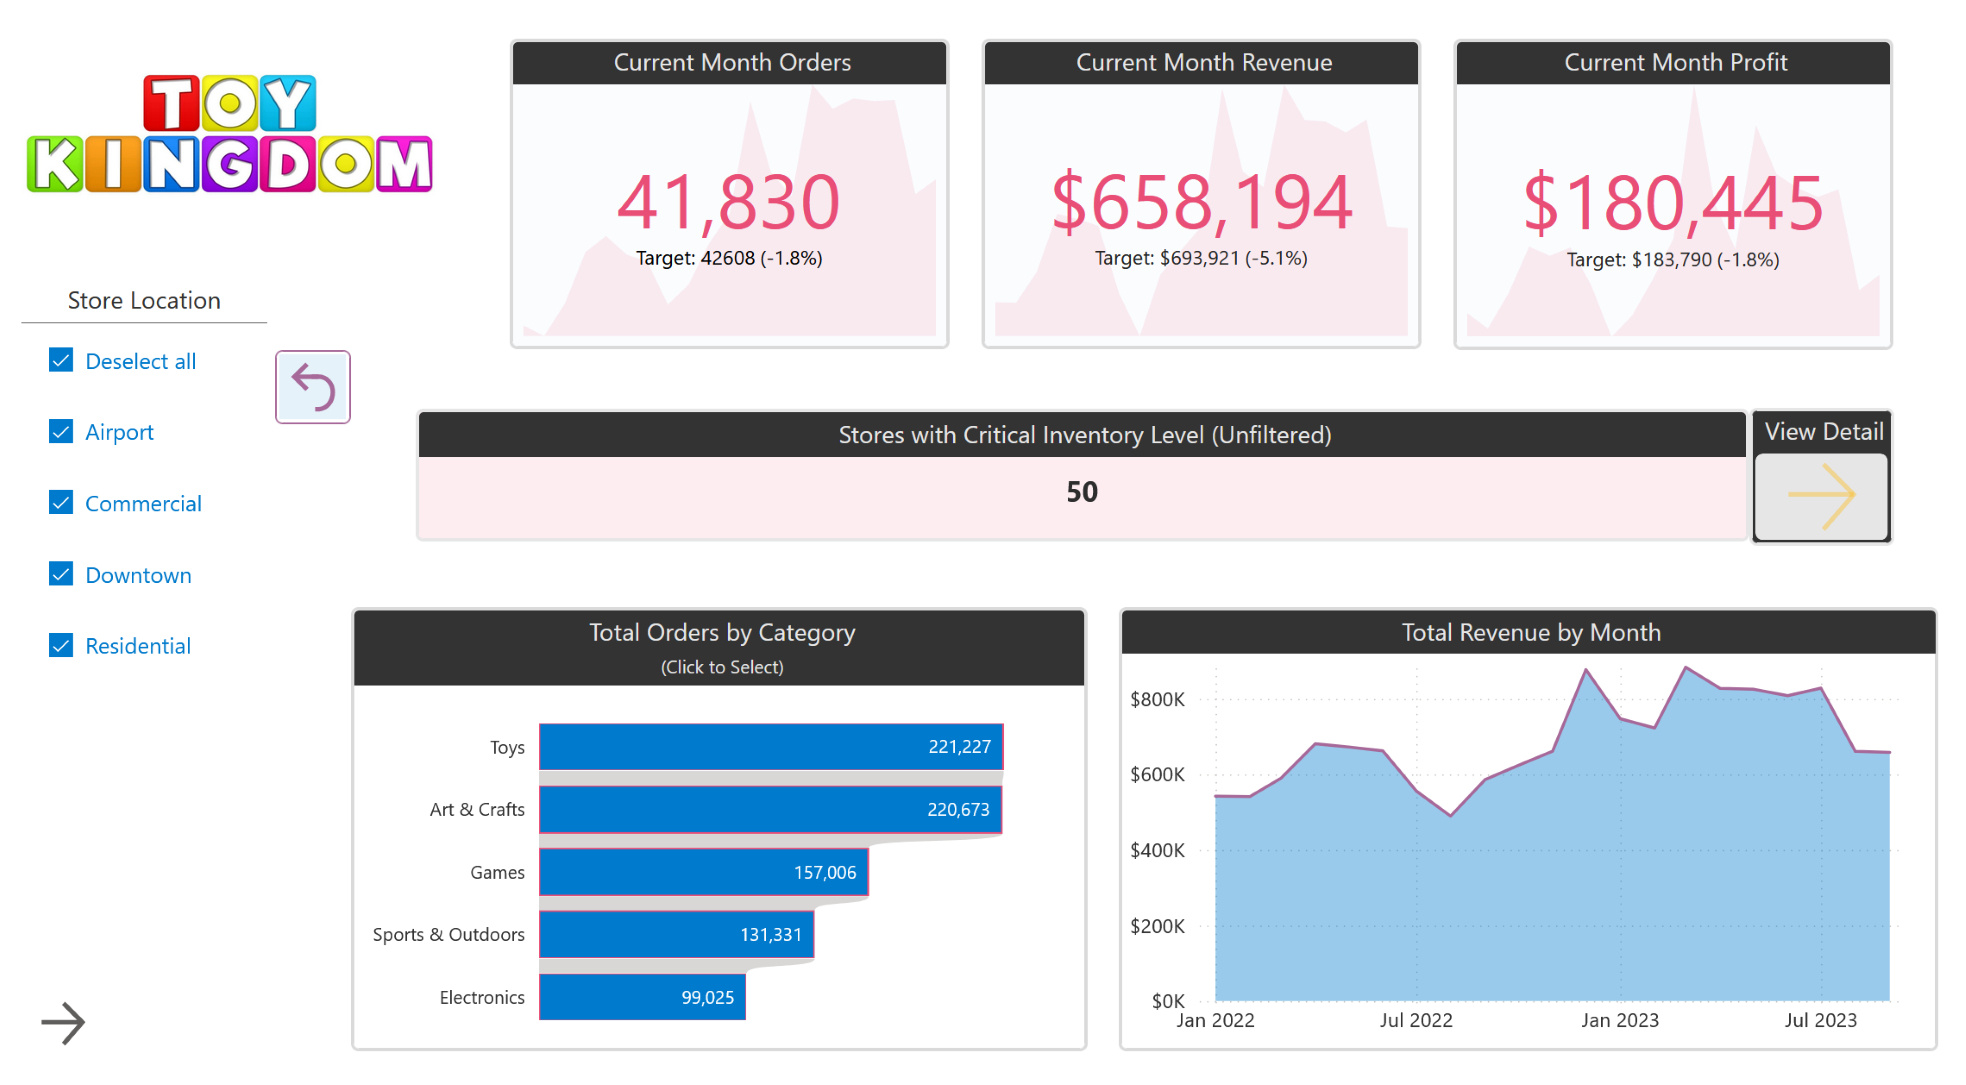
Two-page report with page navigation. The main page tracks current month orders, revenue, and profit against targets using KPI cards with variance indicators. A store location slicer filters all visuals by location type. Orders by category uses a bar chart as a click-to-filter selector. Custom color theme pulled from the Toy Kingdom logo.The second page surfaces stores with critical inventory levels. It includes DAX calculated columns for average monthly orders, months of stock remaining, and a risk level classification (No Supply, Critical, Low, Moderate, Healthy, No Demand). Conditional formatting on the risk level column provides visual urgency at a glance.
Techniques Used
| Star schema data model | DAX calculated columns | KPI cards with target variance |
| Conditional formatting | Data bars | Slicer filtering |
| Click-to-filter visuals | Page navigation | Custom color theme |
Data Model
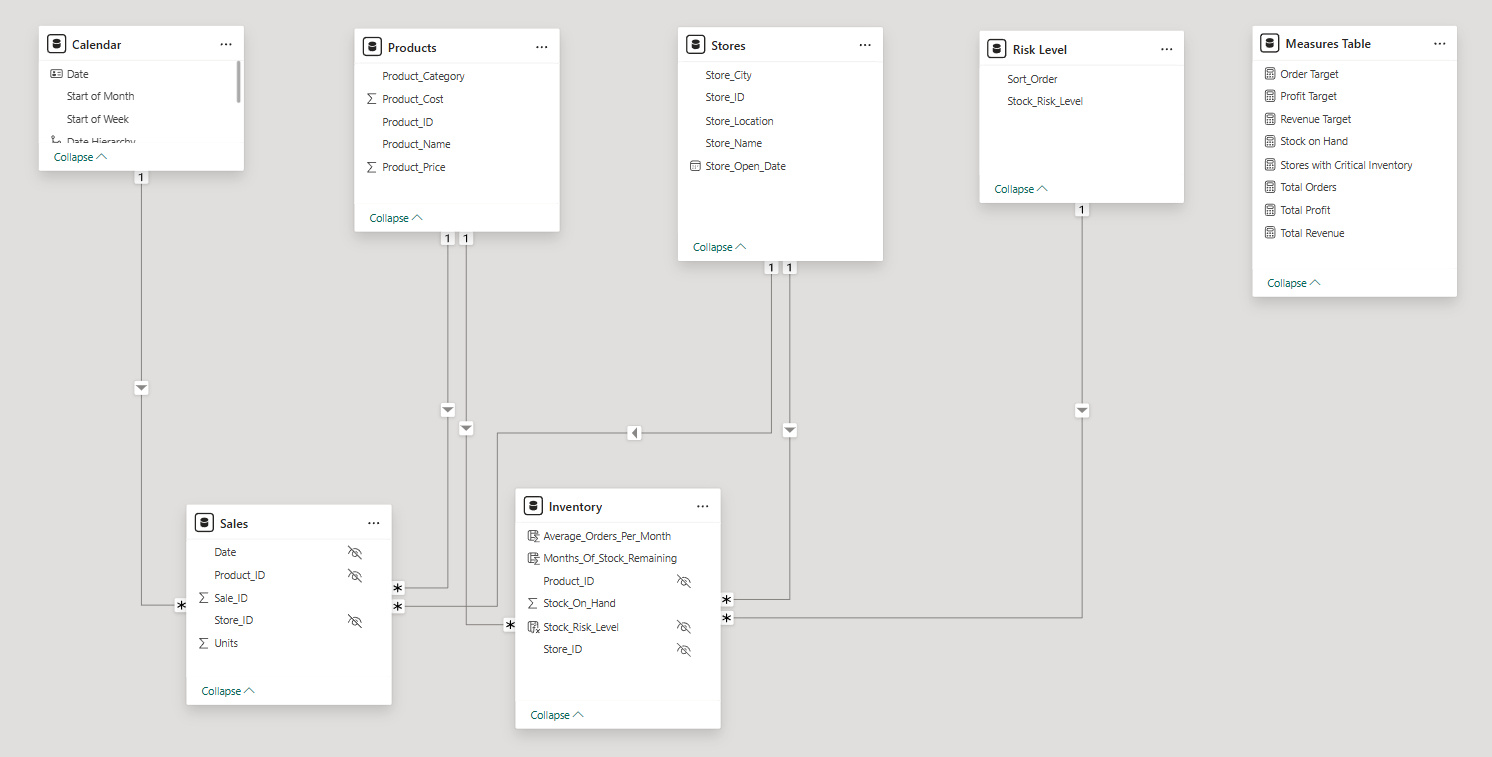
Star schema with two fact tables (Sales and Inventory) connected to four dimension tables: Calendar, Products, Stores, and Risk Level. A dedicated Measures Table keeps DAX measures organized and separate from source data tables. The Inventory table includes calculated columns for Average Orders Per Month, Months of Stock Remaining, and Stock Risk Level — the logic behind the inventory risk page.